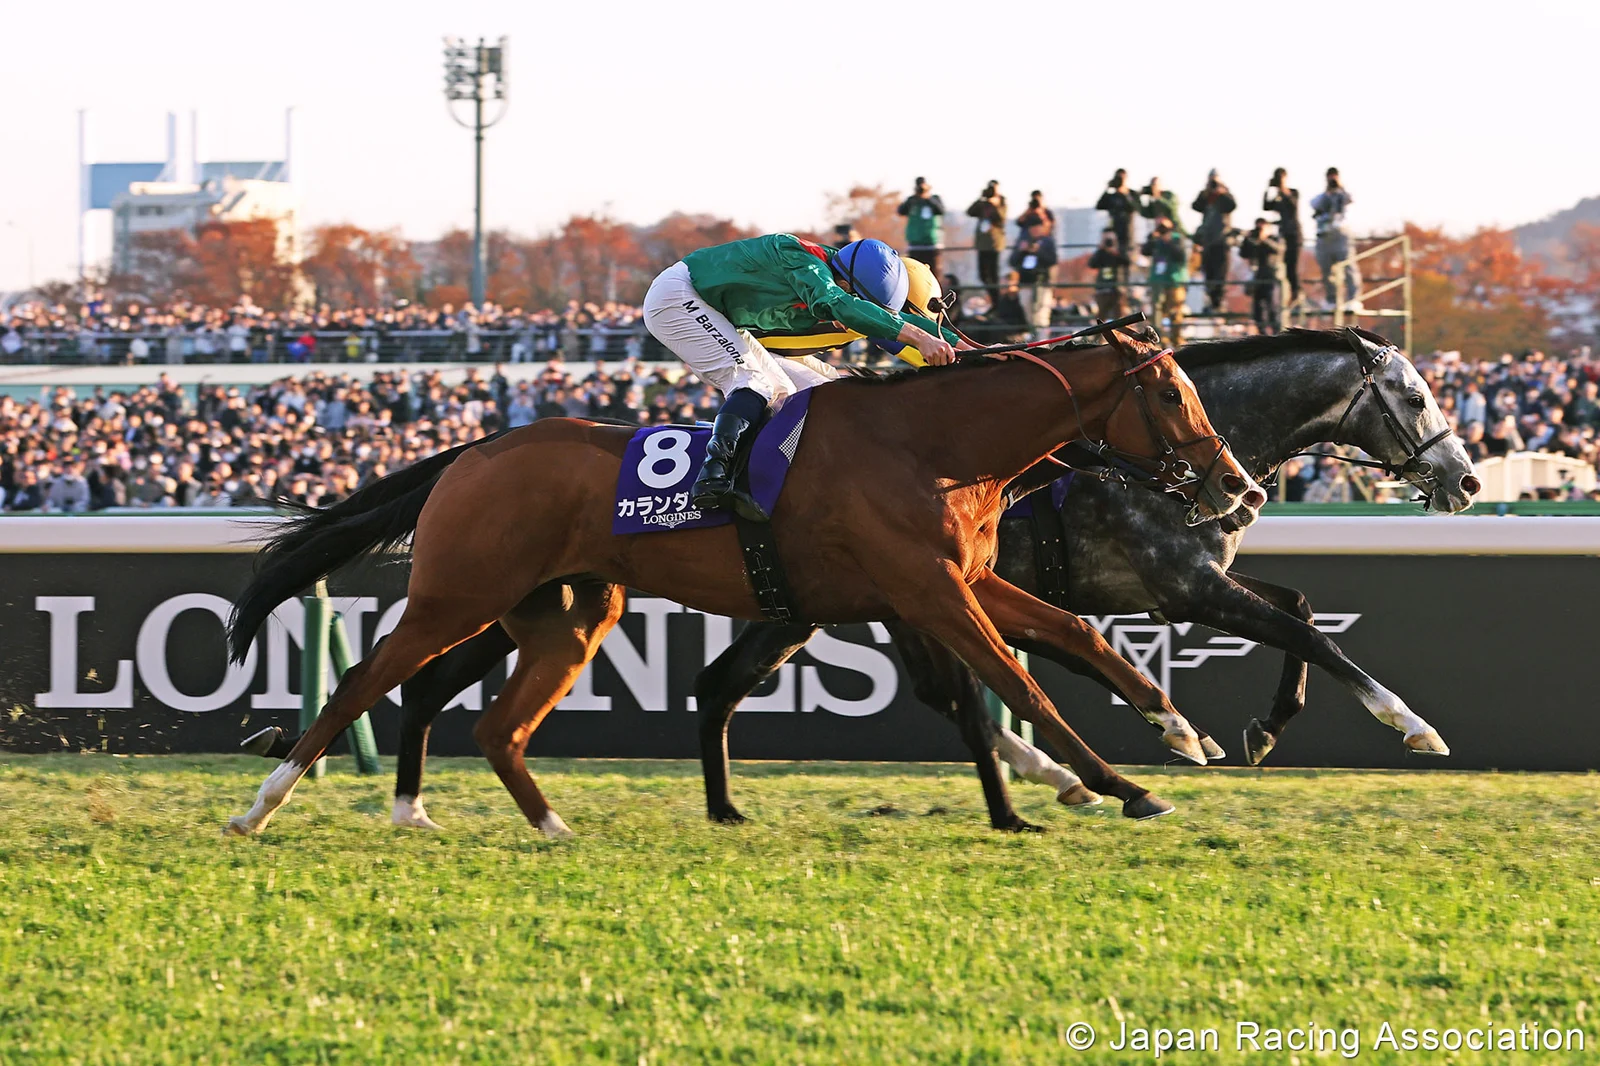
Horse racing has major followings in Japan, Britain, Ireland, Australia, France and the United States, while Hong Kong is an especially significant racing jurisdiction. There is no single, universally comparable popularity ranking. This guide uses dated attendance, wagering and breeding evidence to explain where racing has a strong presence, what each measure actually shows, and why Kentucky is a prominent—but incomplete—answer to the American version of the question.
Popularity has more than one measurable meaning
Japan, Australia, Britain, Ireland, France and the United States are important racing countries, while Hong Kong is a major racing jurisdiction with a concentrated local calendar and international betting reach. They belong in a serious discussion of the sport's following. Declaring one the most popular, however, requires choosing what to measure.
The evidence below uses named official reports and identifies their reporting periods. It is a map of different strengths, not a numerical league table assembled from incompatible totals. A calendar year, a racing season and one summer meeting are not equal units, even when all three reports contain impressive numbers.
Attendance, betting and participation answer different questions
Attendance measures visits to the races. Someone who attends ten times can contribute ten admissions; the total is not necessarily a count of ten different people. A sold-out festival demonstrates demand for that event, but does not reveal how often the same spectators follow ordinary meetings.
Betting turnover measures the amount staked, not the operator's profit or the number of fans. The same money can be bet again after a return, and a relatively small group of active customers can contribute substantial turnover. International wagering can also support a jurisdiction's races without the money originating from people who live there.
Participation and production add another perspective. Numbers of races, runners, owners or foals show the scale of the racing system and its supporting industry. They are useful when asking where horses are bred or how much racing takes place. They do not establish the percentage of residents who watch.
The IFHA's international statistical resources provide a route into comparisons, but a popularity claim still needs its own definition. Use the same period and discipline for a direct ranking, and examine currency and reporting scope when comparing financial figures. A large purse, a famous champion and a full grandstand each tell a story; none alone supplies a complete national audience survey.
Japan and Hong Kong show the scale of racing audiences and betting
Japan and Hong Kong belong in any serious discussion of racing's popularity, but their evidence describes different systems. Japan combines a national circuit with local-government racing. Hong Kong concentrates a substantial international racing business in a much smaller jurisdiction. Looking at their underlying figures makes both stories more interesting than simply awarding one of them first place.
Japan's national and local racing systems
The Japan Racing Association recorded 5,229,782 admissions and 3,455 races in 2025. Its net pari-mutuel sales reached approximately JPY3.506 trillion, overwhelmingly through off-course channels. These figures describe JRA racing; the country also has a separate local-government racing system. The distinction matters when comparing a Japanese total with another country's whole industry. The underlying figures are available in the JRA annual statistics, while the official racing outline explains the two systems.
Those admissions establish a substantial live audience across a season, rather than just one crowded championship afternoon. Off-course sales also show why the size of a grandstand is an incomplete measure of interest. A fan following races remotely contributes to wagering activity without passing through a racecourse gate. Conversely, someone attending with friends can enjoy the sport without placing a bet.
For a visitor, this means choosing between two kinds of exploration: attending a major national meeting or discovering a local racing program. They are parts of the same country's sporting landscape, but a guide or dataset limited to JRA should identify that boundary. It is particularly unhelpful to mix a local calendar with national statistics and then assume that every meeting has the audience implied by the national total.
Hong Kong is a concentrated racing jurisdiction
Hong Kong should be identified as a racing jurisdiction, rather than counted as a separate sovereign country. The HKJC's 2025–26 media guide reports more than 1.7 million racecourse admissions during the 2024/25 season, which comprised 88 meetings and 847 Hong Kong races. That is a season-based measure, unlike Japan's calendar-year figures above.
The club reported approximately HK$138.9 billion in racing wagering turnover for that season. Its annual results announcement also describes substantial overseas commingling, in which bets from partner markets enter shared pools. The turnover therefore demonstrates an international betting business as well as local engagement. It cannot be divided by Hong Kong's population to produce a meaningful estimate of what the average resident spends.
The same report describes different experiences at Happy Valley and Sha Tin, from evening entertainment to major international racedays. For spectators, that concentration makes racing easy to encounter within an urban visit. For researchers, it explains why geography alone is misleading: a compact jurisdiction can operate a racing product with a much wider audience than its physical footprint suggests.
Britain, Ireland, Australia and France sustain different racing cultures
A broad racing culture can be visible in the number of ordinary meetings, the survival of regional clubs and the variety of horses people follow. These four countries illustrate why a famous race is a useful introduction but an incomplete explanation of the sport's position. Their published figures also give concrete examples of what an international comparison should measure.
Britain and Ireland: attendance and the racing calendar
Britain recorded approximately 5.031 million racecourse admissions in 2025, up 4.8% from 2024, according to the BHA's annual report. Yet the same report recorded a 4.3% decline in betting turnover. This is a useful real-world example of two popularity measures moving in opposite directions. More visits to racecourses did not mean that every commercial measure increased.
In Ireland, Horse Racing Ireland's 2025 statistics reported 1.316 million admissions across 390 fixtures. These are figures supplied by racecourses, rather than a survey of how many different people follow racing. They nevertheless show sustained attendance across a full annual program.
Both countries also offer Flat and jump racing. The distinction changes the spectator's calendar: summer turf Flat festivals and the main winter jump season create different annual rhythms. Great British Racing's guide to the two codes explains that seasonal emphasis, alongside year-round opportunities. Following one code alone can therefore give a visitor an incomplete impression of how often racing happens.

That variety offers a practical choice. Someone attracted to jumping obstacles can build a trip around that discipline, while a visitor interested in Flat breeding and major turf races can choose another part of the calendar. A total attendance figure helps establish the scale of the sport; it does not decide which experience that person will enjoy.
Australia: a broad network beyond the Melbourne Cup
Australia's case rests partly on the breadth of its racing network. The Racing Australia 2024/25 Fact Book identifies 387 race clubs in its account of Thoroughbred racing. Its major-club table stretches from metropolitan organizations in Sydney and Melbourne to clubs in Darwin and Alice Springs. That describes a substantial organizational footprint beyond the Melbourne Cup.
A club is not necessarily one racecourse. The same table lists several tracks under some clubs, including Caulfield, Sandown and Mornington under the Melbourne Racing Club. Treating the club count as a track count would change what the statistic means. It also says nothing by itself about the average attendance at each meeting.
For trip planning, the geographic spread is more useful than a claim that Australia is the world's most enthusiastic country. Choose the region first and inspect the local fixture program, rather than assuming that every worthwhile meeting requires travel to Melbourne. A metropolitan carnival and a regional meeting can both belong to an extensive racing culture while offering very different crowd sizes, facilities and travel demands.
France: include trotting when defining the sport
France's national picture becomes distorted if horse racing is treated as a synonym for Thoroughbred galloping alone. A joint industry account published by France Galop reports 2.6 million visits to 231 racecourses in 2025. Its examples include both the Prix de l'Arc de Triomphe and the Prix d'Amérique trotting festival at Paris-Vincennes.
By comparison, France Galop's report on its own five managed racecourses gives 438,000 visitors for that year. That smaller figure covers a particular set of venues, including ParisLongchamp and Chantilly. It is not a competing estimate of the same national total, and the two figures should not be added together.
The distinction changes a visit as well as a spreadsheet. ParisLongchamp and Vincennes do not provide interchangeable versions of one event: the racing disciplines differ. Someone seeking the Arc should plan around galloping; someone curious about trotting should explore that calendar specifically. France belongs in this discussion because of the reach and variety of its racing, not simply because one Parisian race has international prestige.
Where is horse racing most popular in the United States?
Kentucky is the clearest starting point when the question combines Thoroughbred breeding and a nationally recognized showcase. New York, California and Florida deserve attention for other parts of the racing industry. This is an assessment based on identifiable evidence, rather than a claim that a comparable state-by-state survey has established where the largest percentage of residents are fans.
Kentucky's breeding concentration and national showcase
The Jockey Club's registered US foal-crop table, updated October 12, 2026, attributes 8,045 registered foals from the 2024 crop to Kentucky, or 49.7% of the US total. The crop year is 2024, even though the table was updated later; registrations can continue to change the count. This is powerful evidence of Kentucky's concentration of Thoroughbred production.
It does not mean that half of America's racing fans live in Kentucky, or that half of all US horse breeds are born there. It describes one defined breed's registered crop. The breeding concentration helps explain why the state features so prominently in discussions of racing's institutions and bloodstock, while leaving the question of audience size open.
The Kentucky Derby supplies a different indicator. Churchill Downs' official historical attendance table records 147,406 for Derby Day in 2025. That is an event crowd, including people who travel to Kentucky, rather than a census of local interest. Together, the breeding and event evidence support Kentucky's prominence much more clearly than an unsupported statement that every resident follows racing.
New York, California and Florida offer other kinds of scale
New York provides an example of a sustained destination meeting. NYRA reported 1,061,787 paid admissions during Saratoga's 40-day summer meet in 2025. The official meet report separates that figure from the larger total covering additional racing festivals. It is therefore possible to cite a specific meeting rather than loosely combine every Saratoga date into one summer-meet number.
For an American comparison, that distinction is especially helpful. Derby Day's single-day crowd and Saratoga's entire meet attendance answer different questions. One illustrates the pull of a flagship event; the other shows repeated activity across a season. A visitor deciding between them should consider whether the goal is one celebrated afternoon or several days following a racing program.
New York, California and Florida also follow Kentucky in the cited 2024 US Thoroughbred foal-crop ranking, with 1,372, 1,063 and 991 registered foals respectively. That confirms significant breeding activity in all three, without establishing their order for spectatorship. Other states may be especially important when the question includes harness racing, Quarter Horses or a particular regional circuit.
For live racing in California or Florida, move from the state-level discussion to a named venue. The Del Mar calendar and Gulfstream Park racing page are useful examples. An active racecourse does not necessarily have live racing on every date, and a simulcast offering is different from horses competing there in person. The relevant local program is what turns a broad interest in American racing into an actual visit.
Choose a racing destination by the experience you want
The evidence points to several strong racing destinations rather than one universal winner. A useful next step is to turn the broad question of popularity into a specific experience: a famous championship race, a regular local meeting, a jump-racing afternoon or an introduction to trotting. The country with the highest figure in an industry report may not offer the event you want during your travel dates.
Start with the discipline, then choose a region and an actual meeting. For a first visit, check whether the ticket is general admission or includes a reserved place, how to reach the track and when the gates open. First post is the first race's scheduled start; arriving then can leave little time to find your bearings. A major event can also require a different admission arrangement from an ordinary raceday.
For American options, use our state guides to narrow the location and the racecourse directory to identify the venue and its published dates. Those pages cover US racing, so use the relevant national authority or racecourse for an overseas trip. Our international racing overview explains the different formats and viewing context behind the countries discussed here.
A broad spectator base, substantial betting activity and a strong breeding industry can reinforce one another, but each describes a different relationship with horses. Keeping those relationships visible produces a more useful answer to where racing is popular—and a better basis for choosing which part of the sport to explore yourself.
Join the conversation
Have a question or a race-day tip to share? Keep it friendly and on topic. Comments appear after review.
No comments yet. Start the conversation.
Sign in with Google to leave a comment.