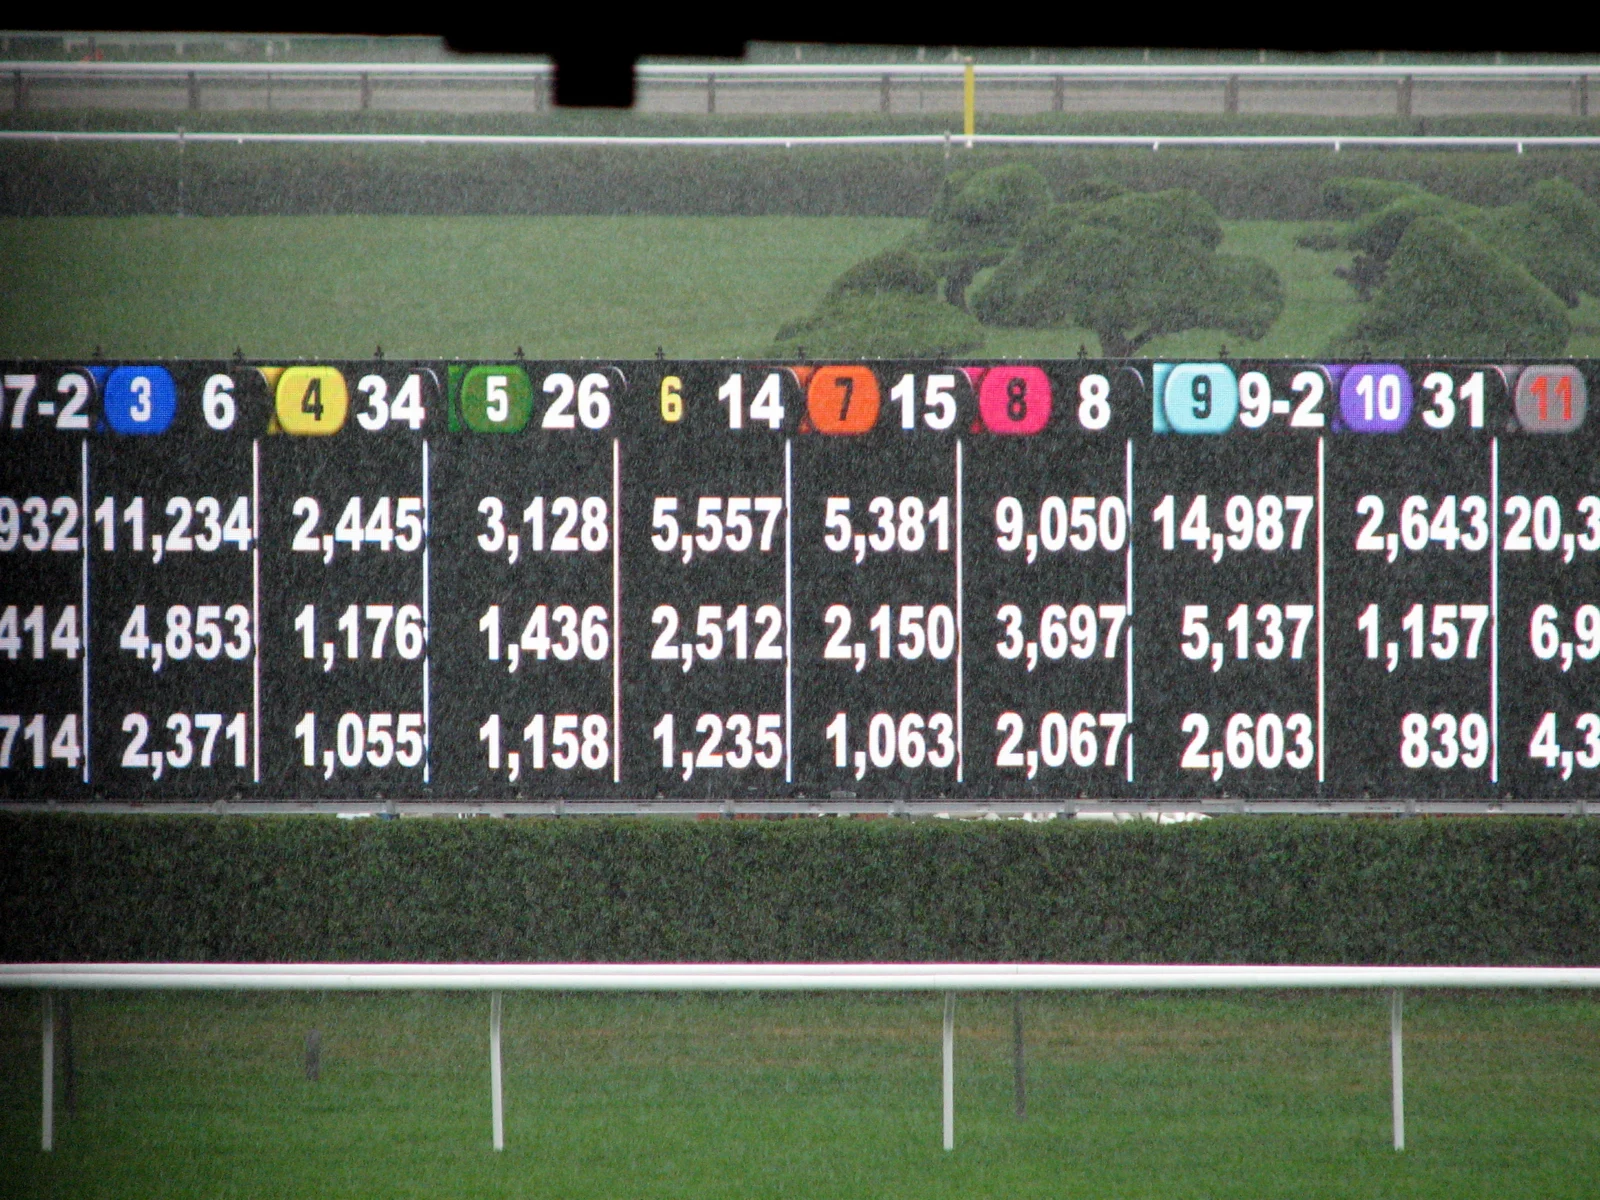
For a winning win bet at exact fractional odds, multiply your stake by the fraction to calculate profit, then add the stake to obtain total return. For an actual official payout, scale its stated base amount instead. This horse racing odds payout chart explains both calculations, separates win prices from place and show payments, and checks the full cost of combination tickets. All numerical race scenarios below are hypothetical, not live odds or picks.
Use the win-odds chart without confusing return and profit
A win-odds chart answers a narrow question: what would a winning win bet return at the exact fraction shown? It does not tell you which horse will win, and it is not a chart of place, show or exacta prices. The figures below are independently calculated mathematical examples for a $2 stake. Actual race payments should be checked against the official posted payout.
| Fractional win odds | Profit on $2 | Total return |
|---|---|---|
| 1/10 | $0.20 | $2.20 |
| 1/2 | $1.00 | $3.00 |
| 4/5 | $1.60 | $3.60 |
| 1/1, evens | $2.00 | $4.00 |
| 6/5 | $2.40 | $4.40 |
| 3/2 | $3.00 | $5.00 |
| 5/2 | $5.00 | $7.00 |
| 7/2 | $7.00 | $9.00 |
| 9/2 | $9.00 | $11.00 |
| 6/1 | $12.00 | $14.00 |
| 12/1 | $24.00 | $26.00 |
| 25/1 | $50.00 | $52.00 |
Read the two numbers in fractional odds
At odds of a/b, the profit on a winning stake is stake × a ÷ b. The total return is that profit plus the stake. Ontario Racing's odds explanation makes the distinction clear. The denominator describes the ratio; it does not require you to stake exactly that many dollars.
For an original example, a $4 win stake at exactly 3/2 has $6 profit: four multiplied by three, divided by two. The total return is $10. A $2 stake at the same fraction produces half those amounts. Writing “profit” and “total return” beside the numbers prevents the common mistake of treating the amount handed back as money gained beyond your original expenditure.
Evens means 1/1. A winning $2 stake therefore earns $2 and returns $4 in total. The ratio is about price, not a promise that one of your next two wagers will win. A longer-priced runner offers a larger return if successful, but that larger number alone supplies no evidence that it is the better selection.
An odds-on winner returns less profit than its stake
Odds-on describes a fraction below evens, such as 1/2. In a hypothetical exact-price calculation, a winning $5 stake earns $2.50 and returns $7.50. The profit is smaller than the stake, yet the winning ticket has not lost money: the original $5 comes back too. The Pennsylvania racing explanation illustrates the same profit-plus-stake principle.
If that $5 ticket loses, its return is zero and the loss is $5. Calling a runner a favorite does not insure the stake. That asymmetry is useful to understand before comparing several small wins with one lost wager; count the actual money spent and received, rather than counting winning tickets alone.
Be careful when comparing formats. Fractional 3/2 describes profit of one and a half times the stake; the corresponding mathematical decimal total-return multiplier is 2.50. That does not make fractional 5/2 the same price. In this guide, fractions describe win profit ratios, while the dollar column explicitly describes total return.
Scale an official payout using its stated base amount
When the result is official, the posted payout is more useful than rebuilding a price from an odds fraction. First identify the base amount beside that payout. A result quoted for a $2 wager is a reference unit, not automatically the amount you staked. Ontario Racing's results explanation shows how changing the amount on the same winning combination changes the return proportionally.
The working formula is total return = posted payout × accepted winning stake ÷ quoted base. For an original hypothetical example, imagine an official win price of $8.60 per $2. A $5 winning stake is two and a half base units, so $8.60 × 2.5 = $21.50 total return. Its wager profit is $21.50 minus the $5 stake, or $16.50. These figures are not a quote from an actual race.
A permitted $1 winning stake at that same hypothetical price would return $4.30, while $10 would return $43. The amount you multiply is the stake on the successful wager or combination, not the sum spent on every selection in a box. That difference becomes especially important when only one of several paid combinations wins.
Do not add the stake again after scaling a total-return price. The $21.50 above already includes the winning $5 stake. Adding another $5 would overstate the amount received. For a clear note, keep three separate entries: amount wagered, money returned and return minus stake. The last is the wager's result before any separate taxes or account charges, not a statement about your entire day.
The minimum accepted stake and the base used to publish a result are separate labels. For example, the Keeneland wager menu lists a $1 win minimum. That does not turn every external result table into a $1 table. Read the actual result's base rather than assuming it from the smallest stake the track permits.
Before using the formula, match the track, date, race, wager type and horse or combination. A payout under the place column is not the win price for that horse. A nearby race on the same card can have an identical runner number but a completely different payment. Our race results help locate the event; the official track or accepting operator remains the place to verify an actual ticket payment.
For any amount outside the examples, check that the menu actually permits it. Proportional arithmetic explains a qualifying accepted wager; it does not create a right to place a fraction of a unit the operator does not offer. Read first, identify the base second and calculate last.
Understand why a live price can differ from your calculation

.jpg)
The chart assumes an exact fraction for a winning bet. A pari-mutuel race has a changing market before betting closes, followed by an official price. Using the right formula on the wrong stage of that market can produce a perfectly tidy number that was never the final payment. Identify what the displayed figure represents before calculating anything.
The morning line and live odds answer different questions
Keeneland's odds dashboard separates the early morning line, the current betting price and a projection of the final price. Those are three different labels. The first and third are estimates; the live figure describes the market at that moment. None should be mistaken for a final payment guaranteed when you first looked at the racecard.
A runner you saw at longer odds early can return less if its final price shortens. That does not mean the arithmetic chart failed: its input changed. Record an early price as an early price, and check the official result afterward. NYRA's betting FAQ explains that final odds can appear after the start because the display reflects the final pool; that is not permission to bet after the start.
Nor is the fraction a measurement of the horse's true chance. In abstract price arithmetic, 4/1 corresponds to a one-in-five, or 20 percent, break-even chance before other considerations. That conversion is not evidence this particular runner will win once in its next five starts. A market price and an independently assessed sporting chance answer different questions.
Pool deductions and payout rules affect the final price
Takeout is deducted from the betting pool before distribution; it is not an extra percentage you subtract from the official total-return price. Keeneland's pool explanation describes that structure. A published rate should always be checked for the particular track and wager, rather than applying one remembered percentage to every race.
For a simplified hypothetical pool, suppose $12,000 is wagered and an illustrative 15 percent is deducted. That leaves $10,200. If $3,000 was staked on the winner, each winning dollar receives $3.40 before any applicable payout adjustment: $10,200 divided by $3,000. A $2 winning stake would therefore return $6.80, including $2 of stake, for $4.80 profit. The percentage and pool are invented for the calculation; they are not Keeneland's announced win rate or an actual race result.
Rounding rules also require local context. Kentucky's provision effective July 15, 2026 permits specified five-cent rounding of the final cash transaction when pennies are unavailable, after individual items and charges have been calculated to the exact cent. It is not an instruction to round every odds entry separately. Noncash transactions continue to settle to the cent. It is therefore unsafe to apply an old rule about rounding down to a dime to every current US transaction.
Use the official price and the accepting operator's actual settlement for a real ticket. The chart is a reading aid, not a substitute for the applicable payout rules or a way to establish that a small difference must be an error. Keeping those jobs separate makes the reference useful without asking it to predict every final cent.
Read place and show payouts from their own pools
A horse's win odds do not supply a place or show price. These are separate wagering pools with different qualifying outcomes. Under the ordinary definitions illustrated in Keeneland's guide, a place bet qualifies if the horse finishes first or second; a show bet qualifies if it finishes first, second or third. They are not bets requiring precisely second or precisely third.
Use the actual price beneath the relevant column, then scale its quoted base. Dividing the win-odds fraction by two for place, or by three for show, has no sound basis. The amounts depend on money in the corresponding pool and its distribution among qualifying bets. A payout chart for fractional win odds cannot reconstruct that missing information.
The result board may list win, place and show prices on the winner's row. That does not award all three to someone who bought only a win ticket. It shows what each qualifying wager pays. Start with the type written on your accepted ticket, then read the matching result column. If no such wager was offered, do not invent a price for it from neighboring columns.
Likewise, a third-place finish can satisfy a show wager while losing a separate win wager on the same runner. “My horse finished in the money” describes the finish, but it does not identify which tickets you purchased or their net result. Official finishing positions, offered pools and accepted wager types must all line up before a payment can be calculated.
Across-the-board returns belong to three separate wagers
NYRA's wager definitions describe across the board as equal win, place and show stakes on one horse. A hypothetical $3 in each pool therefore costs $9. It is not a single $3 ticket that automatically collects three payments.
Imagine that horse is the official winner and that the hypothetical published total-return prices, each per $2, are $8.40 win, $4.60 place and $3.20 show. Scale each by $3 divided by $2. The three gross returns are $12.60, $6.90 and $4.80, totaling $24.30. Subtract all three stakes, totaling $9, and the ticket's profit is $15.30. These are constructed examples, not actual payouts or predictions.
In a separate illustration, a horse finishes third and pays $3.20 per $2 to show. With $3 in each of the three pools, only the show component qualifies. Its return is $4.80 against $9 spent, giving a $4.20 loss. One component paid, yet the whole ticket lost money. This independent example does not assume a real race's prices would remain unchanged if its finish changed.
For unusual results, a dead heat, a scratch or a missing pool, use the actual published result and applicable rule. The familiar three-column layout helps orient the reader; it is not permission to calculate an unannounced price or apply a payment to a wager that was never accepted.
Check combination payouts against the entire ticket cost
For an exacta, read the posted price for the winning first–second order, not the individual horses' win odds. The same principle applies to other combination wagers: the official payout belongs to that winning combination and its quoted base. Ontario Racing's results guide illustrates why a box's cost differs from the stake on its successful order.
Here is a separate hypothetical exacta calculation. A four-horse box contains 4 × 3 = 12 orders. At $2 on each order, its total purchase cost is $24. Suppose one covered order wins and its official total-return price is $18.70 per $1. The $2 staked on that particular order returns $37.40. Subtract the entire $24 purchase cost to obtain $13.40 profit on the box.
Multiplying the $18.70 price by all $24 spent would be a major error. Eleven of the twelve purchased orders did not win. The successful order had $2 on it, even though the single ticket representing the box cost much more. Keep “stake per combination” and “total ticket cost” in separate notes whenever you use a box or a part-wheel.
A fractional base changes the multiplier again. In an independent illustrative trifecta example, a posted $28.60 price per 50 cents would return $57.20 for $1 on the winning combination. That is two base units, not half a unit and not a $2 quotation. The example does not announce a real race price or confirm that every track offers that minimum.
Wait for the result to become official before finalizing the calculation. NYRA's ticket advice is to hold tickets through that stage. If the wager receives a refund or some other treatment under its actual rules, enter the money returned accurately instead of recording the slip as a predicted win or an automatic loss.
A bigger gross payout can still mean a losing session
Extend the hypothetical exacta-box example with four other losing $5 win bets. Those singles cost another $20 and return nothing. Total session expenditure is $44: $24 on the box and $20 on the singles. Total return remains $37.40. The session has therefore lost $6.60, despite a profitable box and a payment larger than any individual win stake.
That ledger is the useful final check: list each ticket's full cost, each actual return and the combined difference. Record refunds separately from winnings so a returned stake does not look like successful race selection. Leave deposits, withdrawals and unspent money outside the wager-profit calculation; moving cash between an account and your pocket does not change what the races earned or lost.
A chart makes arithmetic understandable, not wagering profitable. Keep any bets within the amount you planned to spend, and use the operator's support options if controlling that spending becomes difficult. The best use of the reference is to know exactly what a result means, without mistaking a large number on the board for the balance of your whole day.
Join the conversation
Have a question or a race-day tip to share? Keep it friendly and on topic. Comments appear after review.
No comments yet. Start the conversation.
Sign in with Google to leave a comment.